The mid-developmental transition and the evolution of animal body plans
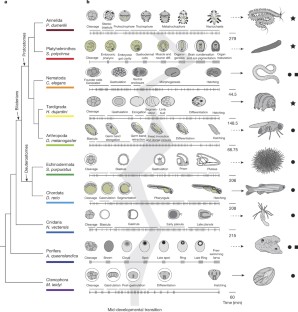
Animals are grouped into ~35 ‘phyla’ based upon the notion of distinct body plans 1,2,3,4 . Morphological and molecular analyses have revealed that a stage in the middle of development—known as the phylotypic period—is conserved among species within some phyla 5,6,7,8,9 . Although these analyses provide evidence for their existence, phyla have also been criticized as lacking an objective definition, and consequently based on arbitrary groupings of animals 10 . Here we compare the developmental transcriptomes of ten species, each annotated to a different phylum, with a wide range of life histories and embryonic forms. We find that in all ten species, development comprises the coupling of early and late phases of conserved gene expression. These phases are linked by a divergent ‘mid-developmental transition’ that uses species-specific suites of signalling pathways and transcription factors. This mid-developmental transition overlaps with the phylotypic period that has been defined previously for three of the ten phyla, suggesting that transcriptional circuits and signalling mechanisms active during this transition are crucial for defining the phyletic body plan and that the mid-developmental transition may be used to define phylotypic periods in other phyla. Placing these observations alongside the reported conservation of mid-development within phyla, we propose that a phylum may be defined as a collection of species whose gene expression at the mid-developmental transition is both highly conserved among them, yet divergent relative to other species.
This is a preview of subscription content, access via your institution
Access options
Subscribe to this journal
Receive 51 print issues and online access
196,21 € per year
only 3,85 € per issue
Buy this article
- Purchase on SpringerLink
- Instant access to full article PDF
Prices may be subject to local taxes which are calculated during checkout
Annelid functional genomics reveal the origins of bilaterian life cycles
Article Open access 25 January 2023
Developmental transcriptomes of the sea star, Patiria miniata, illuminate how gene expression changes with evolutionary distance
Article Open access 07 November 2019

Evolution of tissue-specific expression of ancestral genes across vertebrates and insects
Article 15 April 2024
Accession codes
Primary accessions
Gene Expression Omnibus
Change history
References
- Valentine, J. W. On the Origin of Phyla (Univ. Chicago Press, 2004)
- Haeckel, E. The Evolution of ManVol. 1 (C. K. Paul & Company, 1879)
- Darwin, C. On the Origin of Species by Means of Natural Selection, or, The Preservation of Favoured Races in the Struggle for Life (J. Murray, 1859)
- Gould, S. J. Ontogeny and Phylogeny . (Harvard Univ. Press, 1977)
- Abzhanov, A. Von Baer’s law for the ages: lost and found principles of developmental evolution. Trends Genet.29, 712–722 (2013) ArticleCASGoogle Scholar
- Kalinka, A. T. et al. Gene expression divergence recapitulates the developmental hourglass model. Nature468, 811–814 (2010) ArticleADSCASGoogle Scholar
- Levin, M., Hashimshony, T., Wagner, F. & Yanai, I. Developmental milestones punctuate gene expression in the Caenorhabditis embryo. Dev. Cell22, 1101–1108 (2012) ArticleCASGoogle Scholar
- Domazet-Lošo, T. & Tautz, D. A phylogenetically based transcriptome age index mirrors ontogenetic divergence patterns. Nature468, 815–818 (2010) ArticleADSGoogle Scholar
- Irie, N. & Kuratani, S. Comparative transcriptome analysis reveals vertebrate phylotypic period during organogenesis. Nature Commun . 2, 248 (2011) ArticleADSGoogle Scholar
- Scholtz, G. in Evolutionary Developmental Biology of Crustacea. Crustacean Issues15. 3–16 (A. A. Balkema, 2004) Google Scholar
- Ryan, J. F. et al. The genome of the ctenophore Mnemiopsis leidyi and its implications for cell type evolution. Science342, 1242592 (2013) ArticleGoogle Scholar
- Hashimshony, T., Wagner, F., Sher, N. & Yanai, I. CEL-Seq: single-cell RNA-Seq by multiplexed linear amplification. Cell Rep . 2, 666–673 (2012) ArticleCASGoogle Scholar
- Anavy, L. et al. BLIND ordering of large-scale transcriptomic developmental timecourses. Development141, 1161–1166 (2014) ArticleCASGoogle Scholar
- Davidson, E. H. The Regulatory Genome: Gene Regulatory Networks in Development And Evolution (Academic Press, 2006)
- Ballard, W. W. Morphogenetic movements and fate maps of vertebrates. Am. Zool.21, 391–399 (1981) ArticleGoogle Scholar
- Patel, N. H. Developmental evolution: insights from studies of insect segmentation. Science266, 581–590 (1994) ArticleADSCASGoogle Scholar
- Sander, K. in Development and Evolution (eds Goodwin, B. C., Holder, N. & Wylie, C. C. ) 137–160 (Cambridge Univ. Press, 1983)
- Fischer, A. H., Henrich, T. & Arendt, D. The normal development of Platynereis dumerilii (Nereididae, Annelida). Front. Zool.7, 31 (2010) ArticleGoogle Scholar
- Slack, J. M. W. in Keywords and Concepts in Evolutionary Developmental Biology (eds Hall, B. K. & Olson, W. M. ) 476 (Harvard Univ. Press, 2003)
- Cardona, A., Hartenstein, V. & Romero, R. Early embryogenesis of planaria: a cryptic larva feeding on maternal resources. Dev. Genes Evol.216, 667–681 (2006) ArticleGoogle Scholar
- Martín-Durán, J. M. & Egger, B. Developmental diversity in free-living flatworms. Evodevo3, 7 (2012) ArticleGoogle Scholar
- Adamska, M. et al. The evolutionary origin of hedgehog proteins. Curr. Biol.17, R836–R837 (2007) ArticleCASGoogle Scholar
- Raff, R. A. The Shape of Life: Genes, Development, and the Evolution of Animal Form (Univ. Chicago Press, 1996)
- Richardson, M. K. Vertebrate evolution: the developmental origins of adult variation. Bioessays21, 604–613 (1999) ArticleCASGoogle Scholar
- Slack, J. M., Holland, P. W. & Graham, C. F. The zootype and the phylotypic stage. Nature361, 490–492 (1993) ArticleADSCASGoogle Scholar
- Larroux, C. et al. The NK homeobox gene cluster predates the origin of Hox genes. Curr. Biol.17, 706–710 (2007) ArticleCASGoogle Scholar
- Ryan, J. F., Pang, K., Mullikin, J. C., Martindale, M. Q. & Baxevanis, A. D. The homeodomain complement of the ctenophore Mnemiopsis leidyi suggests that Ctenophora and Porifera diverged prior to the ParaHoxozoa. Evodevo1, 9 (2010) ArticleGoogle Scholar
- Hashimshony, T., Feder, M., Levin, M., Hall, B. K. & Yanai, I. Spatiotemporal transcriptomics reveals the evolutionary history of the endoderm germ layer. Nature519, 219–222 (2015) ArticleADSCASGoogle Scholar
- Hejnol, A. et al. Assessing the root of bilaterian animals with scalable phylogenomic methods. Proc. R. Soc. Lond . B 276, 4261–4270 (2009) Google Scholar
- Dunn, C. W. et al. Broad phylogenomic sampling improves resolution of the animal tree of life. Nature452, 745–749 (2008) ArticleADSCASGoogle Scholar
- Martín-Durán, J. M., Duocastella, M., Serra, P. & Romero, R. New method to deliver exogenous material into developing planarian embryos. J. Exp. Zool. B Mol. Dev. Evol . 310, 668–681 (2008) ArticleGoogle Scholar
- Martín-Durán, J. M., Amaya, E. & Romero, R. Germ layer specification and axial patterning in the embryonic development of the freshwater planarian Schmidtea polychroa. Dev. Biol.340, 145–158 (2010) ArticleGoogle Scholar
- Gabriel, W. N. et al. The tardigrade Hypsibius dujardini, a new model for studying the evolution of development. Dev. Biol.312, 545–559 (2007) ArticleCASGoogle Scholar
- Kiehart, D. P., Crawford, J. M. & Montague, R. A. Collection, dechorionation, and preparation of Drosophila embryos for quantitative microinjection. Cold Spring Harb. Protoc. 2007, http://dx.doi.org/10.1101/pdb.prot4717 (2007)
- Detrich, H. W., Westerfield, M. & Zon, L. I. Essential Zebrafish Methods: Cell and Developmental Biology . (Academic Press, 2009)
- Fritzenwanker, J. H. & Technau, U. Induction of gametogenesis in the basal cnidarian Nematostella vectensis(Anthozoa). Dev. Genes Evol.212, 99–103 (2002) ArticleGoogle Scholar
- Pang, K. & Martindale, M. Q. Mnemiopsis leidyi spawning and embryo collection. Cold Spring Harb. Protoc. 2008, http://dx.doi.org/10.1101/pdb.prot5085 (2008)
- Joshi, N. & Fass, J. Sickle: A sliding-window, adaptive, quality-based trimming tool for FastQ files. https://github.com/najoshi/sickle ((2011)
- Vince, B. Scythe — A Bayesian adapter trimmer . https://github.com/vsbuffalo/scythe (2011)
- Gnerre, S. et al. High-quality draft assemblies of mammalian genomes from massively parallel sequence data. Proc. Natl Acad. Sci. USA108, 1513–1518 (2011) ArticleADSCASGoogle Scholar
- Boothby, T. C. et al. Evidence for extensive horizontal gene transfer from the draft genome of a tardigrade. Proc. Natl Acad. Sci. USA112, 15976–15981 (2015) ArticleADSCASGoogle Scholar
- Koutsovoulos, G. et al. The genome of the tardigrade Hypsibius dujardini. Preprint at bioRxiv http://dx.doi.org/10.1101/033464 (2015)
- Sullivan, J. C., Reitzel, A. M. & Finnerty, J. R. Upgrades to StellaBase facilitate medical and genetic studies on the starlet sea anemone, Nematostella vectensis. Nucleic Acids Res.36, D607–D611 (2008) ArticleCASGoogle Scholar
- Hashimshony, T., Wagner, F., Sher, N. & Yanai, I. CEL-Seq: single-cell RNA-Seq by multiplexed linear amplification. Cell Rep . 2, 666–673 (2012) ArticleCASGoogle Scholar
- Baker, S. C. et al. The External RNA Controls Consortium: a progress report. Nature Methods2, 731–734 (2005) ArticleCASGoogle Scholar
- Langmead, B. & Salzberg, S. L. Fast gapped-read alignment with Bowtie 2. Nature Methods9, 357–359 (2012) ArticleCASGoogle Scholar
- Anders, S., Pyl, P. T. & Huber, W. HTSeq—A Python framework to work with high-throughput sequencing data. Bioinformatics31, 166–169 (2015) ArticleCASGoogle Scholar
- Haas, B. J. et al. De novo transcript sequence reconstruction from RNA-seq using the Trinity platform for reference generation and analysis. Nature Protocols8, 1494–1512 (2013) ArticleCASGoogle Scholar
- Altschul, S. F., Gish, W., Miller, W., Myers, E. W. & Lipman, D. J. Basic local alignment search tool. J. Mol. Biol.215, 403–410 (1990) ArticleCASGoogle Scholar
- Punta, M. et al. The Pfam protein families database. Nucleic Acids Res.40, D290–D301 (2012) ArticleCASGoogle Scholar
- Finn, R. D., Clements, J. & Eddy, S. R. HMMER web server: interactive sequence similarity searching. Nucleic Acids Res.39, W29–W37 (2011) ArticleCASGoogle Scholar
- Li, L., Stoeckert, C. J. & Roos, D. S. OrthoMCL: identification of ortholog groups for eukaryotic genomes. Genome Res.13, 2178–2189 (2003) ArticleCASGoogle Scholar
- Simão, F. A., Waterhouse, R. M., Ioannidis, P. & Kriventseva, E. V. & Zdobnov, E. M. BUSCO: assessing genome assembly and annotation completeness with single-copy orthologs. Bioinformatics (2015)
Acknowledgements
We thank M. Rockman and B. de Bivort for helpful discussions. We also thank U. Gat, A. Salzberg, S. B. Tabou De Leon, M. Blaxter, G. Koutsovoulos, S. Mansour, and B. Goldstein for materials and reagents. We thank the Technion Genome Center for technical assistance and the Radcliffe Institute for Advanced Studies at Harvard University for hosting the analysis phase. This work was supported by a European Research Council grant (EvoDevoPaths), the EMBO Young Investigator Program, and a grant from the Australian Research Council.
Author information
- Michal Levin, Selene L. Fernandez-Valverde & Nagayasu Nakanishi Present address: †Present addresses: Center for Thrombosis and Hemostasis (CTH), University Medical Center Mainz, Mainz, Germany (M.L.); Laboratorio Nacional de Genómica para la Biodiversidad, Centro de Investigación y de Estudios Avanzados del IPN, Irapuato, Guanajuato, Mexico (S.L.F.-V.); Whitney Laboratory for Marine Bioscience, University of Florida, 9505 N, Ocean Shore Blvd, St Augustine, Florida 32080-8610 USA (N.N.).,
- Michal Levin and Leon Anavy: These authors contributed equally to this work.
Authors and Affiliations
- Department of Biology, Technion – Israel Institute of Technion, Haifa, 32000, Israel Michal Levin, Leon Anavy, Alison G. Cole, Eitan Winter, Natalia Mostov, Sally Khair, Naftalie Senderovich, Ekaterina Kovalev, David H. Silver, Martin Feder, Tamar Hashimshony & Itai Yanai
- School of Biological Sciences, University of Queensland, Brisbane, Queensland, Australia Selene L. Fernandez-Valverde, Nagayasu Nakanishi, Sandie M. Degnan & Bernard M. Degnan
- Whitney Laboratory for Marine Bioscience, University of Florida, 9505 N Ocean Shore Blvd, St Augustine, 32080-8610, Florida, USA David Simmons, Joseph F. Ryan & Mark Q. Martindale
- Developmental Biology Unit, European Molecular Biology Laboratory, Heidelberg, Germany Oleg Simakov, Tomas Larsson & Detlev Arendt
- Max Planck Institute of Molecular Cell Biology and Genetics, Pfotenhauerstrasse 108, Dresden, 01307, Germany Shang-Yun Liu & Jochen C. Rink
- Department of Biological Regulation, Weizmann Institute of Science, Rehovot, Israel Ayelet Jerafi-Vider & Karina Yaniv
- Michal Levin
You can also search for this author in PubMed Google Scholar
You can also search for this author in PubMed Google Scholar
You can also search for this author in PubMed Google Scholar
You can also search for this author in PubMed Google Scholar
You can also search for this author in PubMed Google Scholar
You can also search for this author in PubMed Google Scholar
You can also search for this author in PubMed Google Scholar
You can also search for this author in PubMed Google Scholar
You can also search for this author in PubMed Google Scholar
You can also search for this author in PubMed Google Scholar
You can also search for this author in PubMed Google Scholar
You can also search for this author in PubMed Google Scholar
You can also search for this author in PubMed Google Scholar
You can also search for this author in PubMed Google Scholar
You can also search for this author in PubMed Google Scholar
You can also search for this author in PubMed Google Scholar
You can also search for this author in PubMed Google Scholar
You can also search for this author in PubMed Google Scholar
You can also search for this author in PubMed Google Scholar
You can also search for this author in PubMed Google Scholar
You can also search for this author in PubMed Google Scholar
You can also search for this author in PubMed Google Scholar
You can also search for this author in PubMed Google Scholar
You can also search for this author in PubMed Google Scholar
You can also search for this author in PubMed Google Scholar
You can also search for this author in PubMed Google Scholar
Contributions
M.L., T.H., and I.Y. conceived and designed the project. M.L. led the collection of samples with help from N.N., D.S., N.M., S.K. and A.J.-V. The processing of the samples for CEL-Seq was carried out by M.L., T.H., N.M., S.K., and N.S. De novo transcriptome assembly was carried out by L.A. with assistance from I.Y., E.W., J.F.R., and S.-Y.L. Processing of CEL-Seq reads and initial bioinformatics was performed by L.A. with help from M.F., E.W., E.K., D.H.S, O.S., T.L., and S.L.F.-V. The data was analysed by I.Y. and L.A. I.Y. coordinated the interpretation of the data with significant help from B.M.D.; L.A., S.M.D., T.H., A.G.C., D.A., J.F.R., M.Q.M., K.Y., and J.C.R. also contributed to the interpretation of the data. I.Y. wrote the manuscript which the authors commented on.
Corresponding author
Ethics declarations
Competing interests
The authors declare no competing financial interests.
Additional information
The complete data set has been deposited to the NCBI GEO database GSE70185.
Extended data figures and tables
Extended Data Figure 1 A schematic for the de novo transcriptome analysis.
See also the Methods section. CEL-Seq reads were mapped to the published transcriptomes where available.
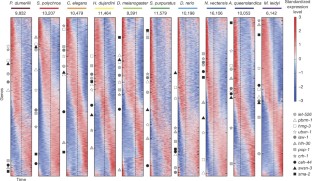
Extended Data Figure 2 Gene expression time-courses for ten species.
a, BLIND analysis on the reported time-courses. The colour indicates the ordering. The species is indicated for each plot. b, The number of dynamically expressed genes for each species. The species are shown in the same order as in the main figures. Constitutively high (low) expression is defined as that where the maximum expression is more (less) than the 10 transcripts per million threshold yet is not dynamic (two-fold change and at least 10 transcripts per million maximum expression).
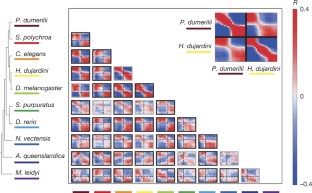
Extended Data Figure 3 Testing the significance of the transition in the orthologue correlation matrices shown in Fig. 3.
a, Schematic indicating the mid-developmental transition (orange), correlations among windows of the same phase (green), and correlations among windows of different phases (grey). b, The orange squares indicate statistical tests examined in c. c, For each pair of species a series of Kolmogorov–Smirnov tests are shown. Each test compares the intra-phase to the inter-phase correlations (a) for the mid-developmental transition and three windows before and after it (b). The yellow boxes indicate those species comparisons where there is significant statistical evidence for the dual-phase pattern (higher significance for the middle tests).
Extended Data Figure 4 Robustness of Fig. 3 analysis.
a, The analysis was repeated using the indicated number of sliding windows. b, The analysis was repeated by randomly removing embryo transcriptomes. From each of the ten data sets, we removed 10%, 20% or 30% of the embryos and repeated the analysis using 20 windows. We repeated this five times and then re-identified the mid-developmental transition. The plot indicates the median and standard deviation of the detected mid-developmental transition windows across these trials. In all species, the median is identical to the mid-developmental transition identified by the complete data set. c, d, Same as Fig. 3, using all detected orthologues for the pairwise comparisons (not limited to 1,500 as in Fig. 3, the number of examined orthologues are indicated above each plot) (c), and a set of 407 orthologues (d) across all taxa.
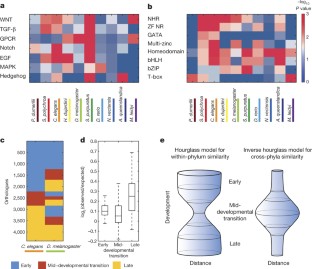
Extended Data Figure 5 Gene enrichment analysis.
a, A landscape showing for each gene (circle) the correlation with an idealized ‘late module profile’ (x axis) and with a ‘transition profile’ (y axis). The idealized profiles used to compute correlations are shown in the insets. Spots correspond to C. elegans genes. They are coloured according to the assigned sets: early module (blue), mid-developmental transition (red), and late module (yellow). b, Gene Ontology (GO) enrichment for the early phase, transition, and late phase gene sets. The gene sets were defined by integrating expression from all ten species. ‘RNA polymerase II…’ is short for ‘RNA polymerase II core promoter sequence-specific DNA binding transcription factor activity involved in preinitiation complex assembly’. The legend indicates the assigned sets: early phase (blue), mid-developmental transition (red), and late phases (yellow). The profiles are of length seven since we examined three windows before and after the mid-developmental transition.
Extended Data Figure 6 PFAM enrichment and conservation across phyla.
a, For each of 5,746 PFAM protein domains, we computed an expression signature based upon the fraction of its genes expressed at each stage throughout development across each of the ten species. As an example of this approach, a shows the signatures for six PFAMs, indicating the normalized fraction of genes in that group expressed at the time points surrounding the transition for each species. The profiles are centred according to the mid-developmental transition as defined in Fig. 3, examining four windows before and after it. The greyscale indicates the fraction of genes expressed in each window. We attributed a phase of expression for each PFAM in each species, as we have for individual genes. To the right of each PFAM signature is the annotated phase; early (blue), mid-developmental transition (red), or late (yellow). We then computed the degree to which the temporal expression across phyla matches a coherent phase expression in three groupings: metazoan, bilaterian, and protostomes. b, Metazoan (all ten species), bilaterian (all except the cnidarian, sponge, and ctenophore), and protostome (nematode, arthropod, tardigrade, annelid, and platyhelminth) groups are shown. To identify PFAMs in the metazoan group, we queried for PFAMs whose signature contains the same temporal phases of expression across the species. The metazoan-consistent PFAMs were nearly exclusively expressed in the early phase, suggesting stronger evolutionary constraints on this phase. A similar pattern was also observed for PFAMs with coherent expression in the seven bilaterian species in our data set. From this analysis, we conclude that bilaterians and protostomes each possess unique suites of innovations that are reflected in these shared phase-specific PFAM enrichments. Interestingly, protostome-coherent PFAMs are biased towards the late phases, possibly related to common differentiation processes operating in these taxa.
Extended Data Figure 7 Same as Fig. 4c, d for PFAM analysis.
The degree of conservation of early, transition, and late phase annotation of PFAMs was computed across species. A similar pattern was observed as that for orthologues (Fig. 4c, d).


